对于一般的项目来说,print_r() echo file_put_contents() exit 这些函数调试就足够了,但是如果你调试的环境还有其他人,那就略胃疼了
服务器环境:centos7 php7.0
本地环境:windows php7.2(压缩包)
本地环境是公司内网,所以中间会借助xshell做一次tcp的转发
服务器配置
安装xdebug
1 | yum install php70w* --skip-broken |
配置xdebug
修改xdebug的配置文件 /etc/php.d/xdebug.ini
1 | ; Enable xdebug extension module |
重启php-fpm
Xshell TCP转发
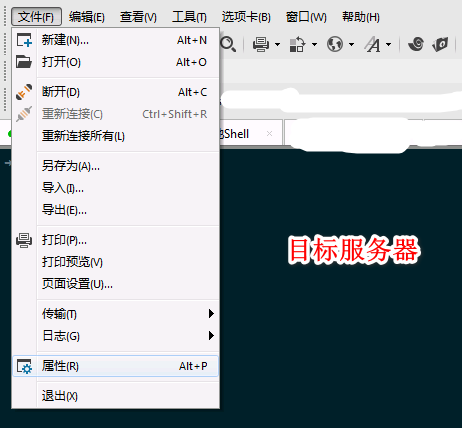
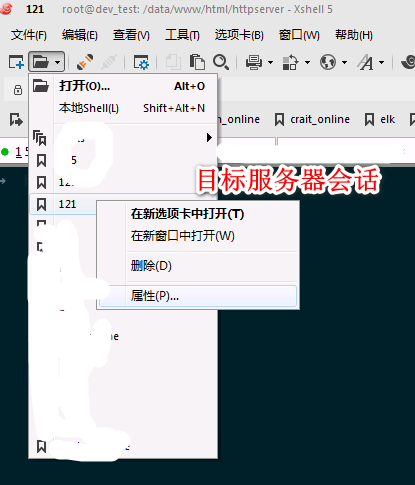
首先连上你需要配置的服务器或者找到目标服务器的会话设置,然后右键找到属性 ,然后找到连接 -> ssh -> 隧道 -> 添加,按如图所示添加,上面配置目标服务器,下面配置本机
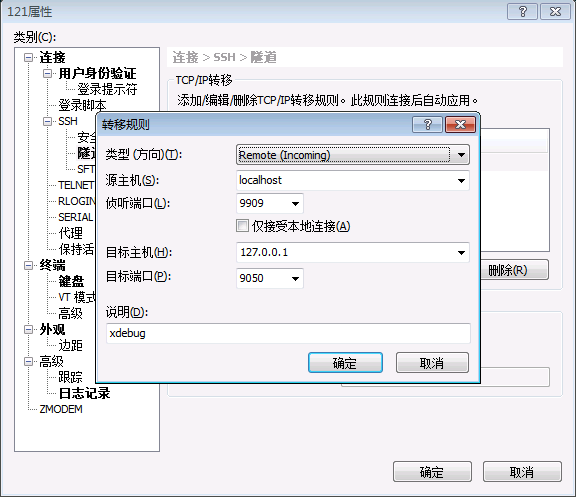
配置完成后分别查看一下 目标服务器的9909 是否被监听
1 | netstat -ano | grep 9909 |
Sublime配置
Xdebug配置
首先通过 package controller安装 xdebug client
然后通过菜单栏的 tool -> Xdebug-> Settings-default, 可以找到xdebug的默认配置(简单摘取)
1 | { |
参考系统的配置及解释,用户可以自行定义 tool -> Xdebug-> Settings-User ,但是用户一般不是只有一个项目,所以个人还是建议针对于每个 project 进行设置,可以通过菜单栏 Project -> Edit Project, 当然,你需要先创建一个project,这都是小事了。
附上个人project配置
1 | { |
SFTP配置
sftp配置就不多废话了,参考另一篇博客Sublime倒腾系列:配置sftp实现文件上传下载
PHPStrom配置
SFTP配置
Tools->Deployment->Configuration,在弹出的对话框里一次填入用户名,密码,
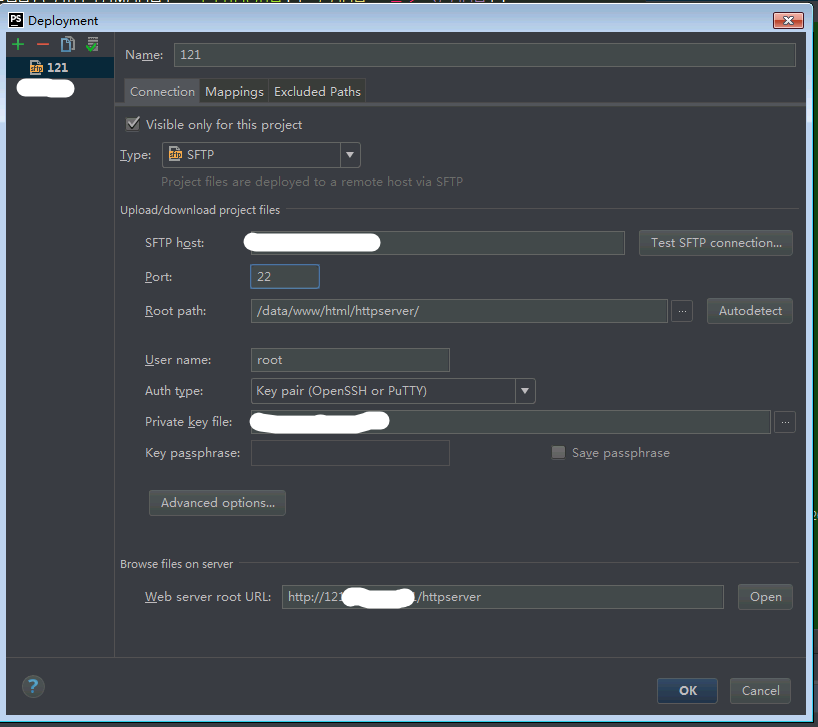
然后右边旁边一个标签页 Mappings
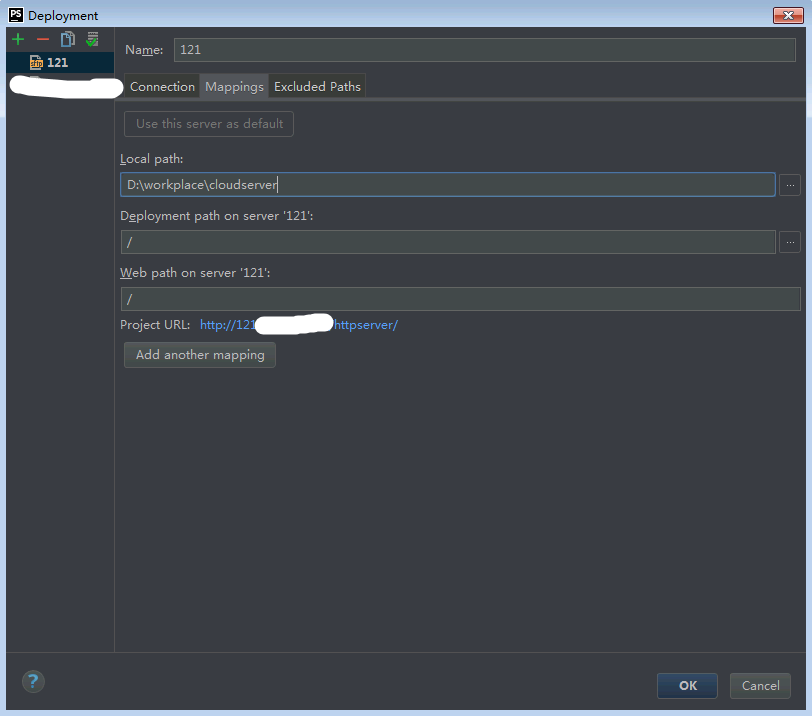
配置完成后,通过 Tools—>Deployment—>Browse Remote Host 看一下右侧是否会列出远程文件,显示绿色表名是对应上了
Server配置
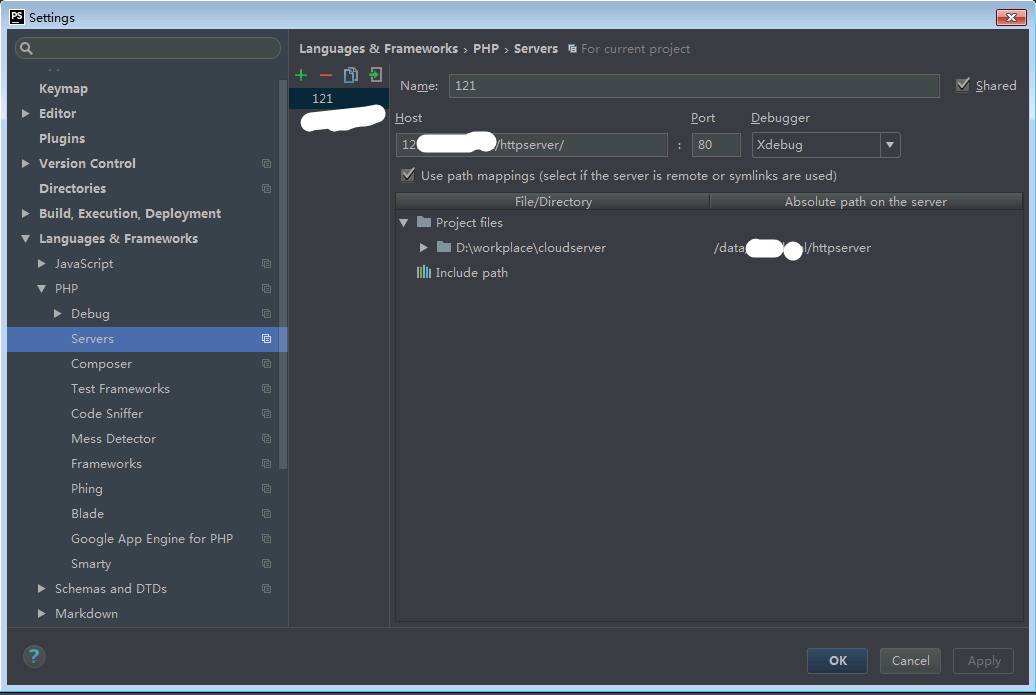
通过 File -> Settings -> Languages & Frameworks -> PHP -> Servers 新建一个Server,输入服务器的IP和端口,最关键的是,将本地工程文件夹和服务器上的文件夹对应起来,方便调试的时候找到源码:
配置Debug
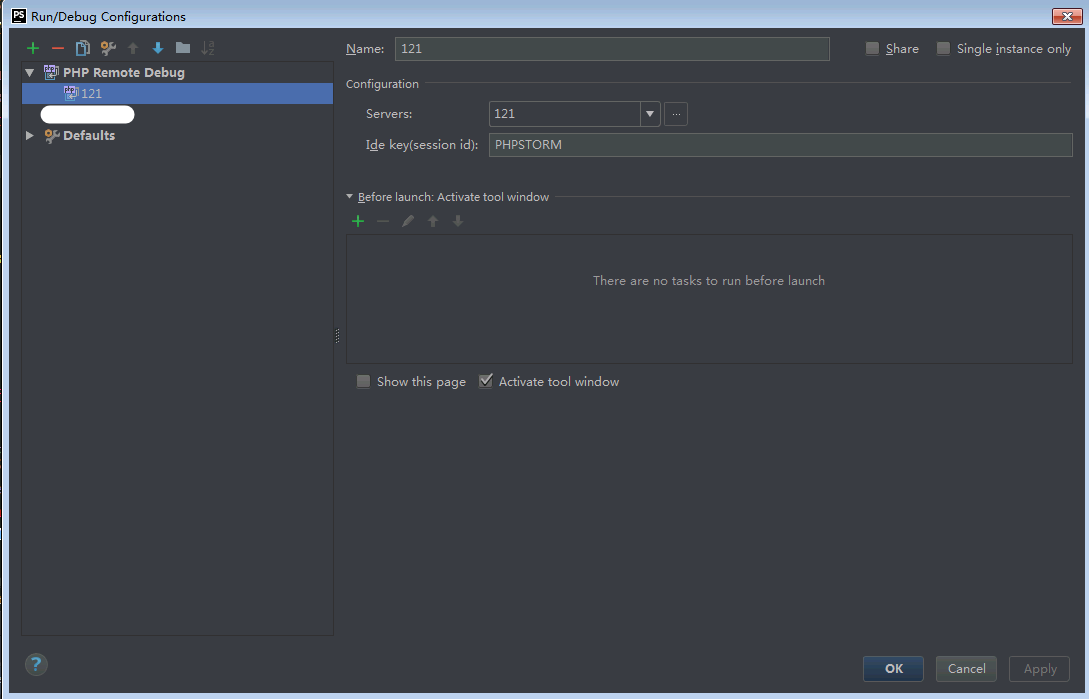
通过Run -> Edit Configurations -> PHP Remote Debug,创建一个新的配置,Servers就选择刚才配置的,Ide Key设置为php.ini里面xdebug.idekey设置的, 这里就是 PHPSTROME
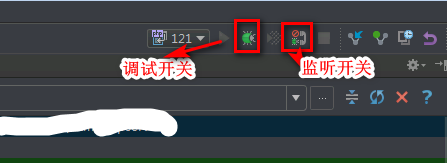
调试(全部配置结束后测试)
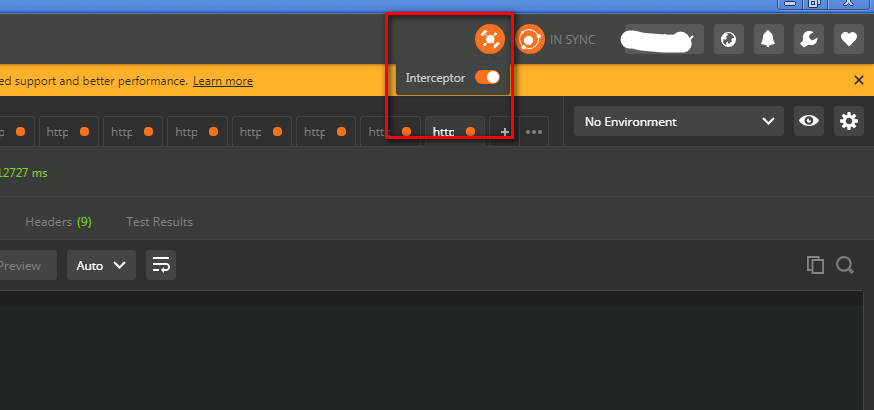
Postman配置
Postman 地址: 谷歌商店
Postman Interceptor 地址: 谷歌商店
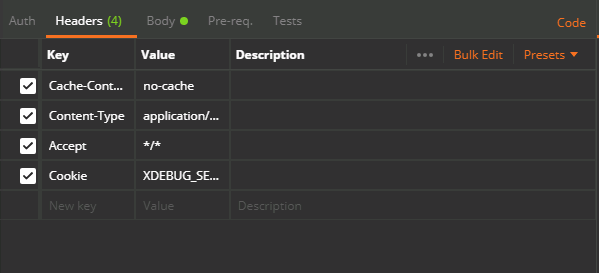
安装完成后,打开Postman, 在右上角开启 Postman Interceptor 即可设置cookie 进行请求了
这时候,只要在模拟请求的时候设置一下cookie,在 phpstrom 或 sublime 设置一下断点就ok了
1 | Cookie:XDEBUG_SESSION=PHPSTORM |